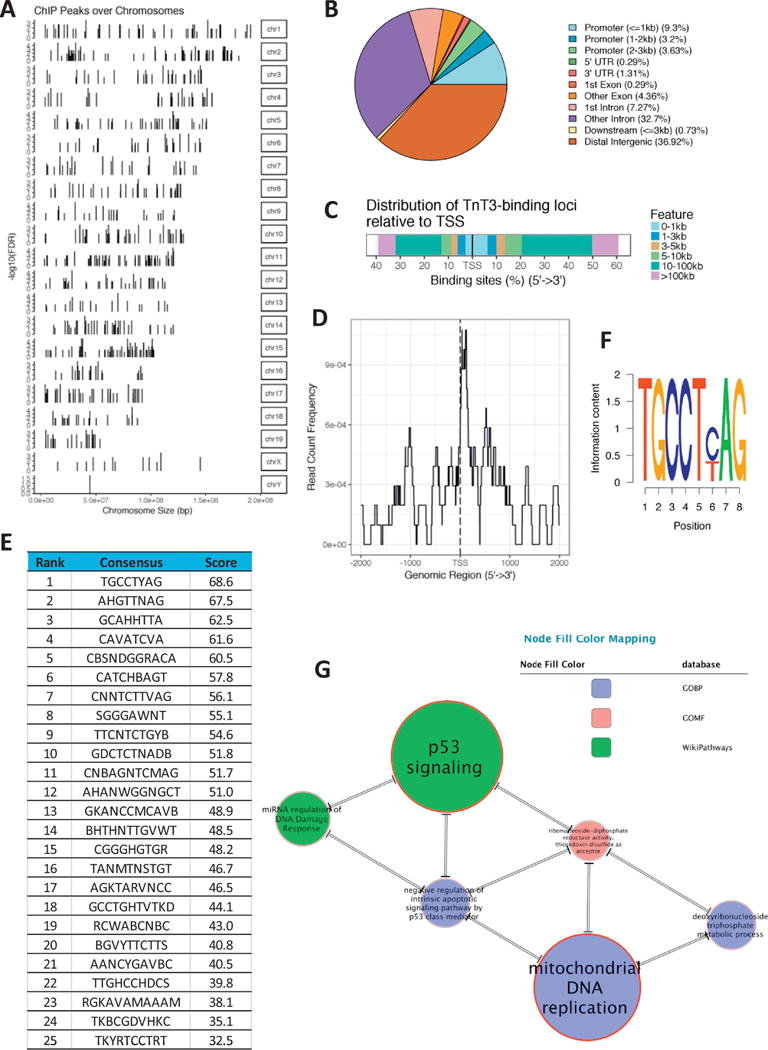
Figure 1.

TnT3 ChIP-Seq Analysis. Localization of genomic sites occupied by TnT3 relative to chromosomal location (A); distribution of peak annotations in terms of genomic features (B); distribution of binding loci relative to the transcription start site (TSS) (C-D). List of the top 25 DNA binding motifs for TnT3 (E) and top sequence logo (F). Top SetRank Subnetwork displaying significant intersections among enriched categories. Double-line edges indicate that the significance of both gene sets was only in the intersection. The size of the nodes and node labels is proportional to the respective SetRank score (G).
