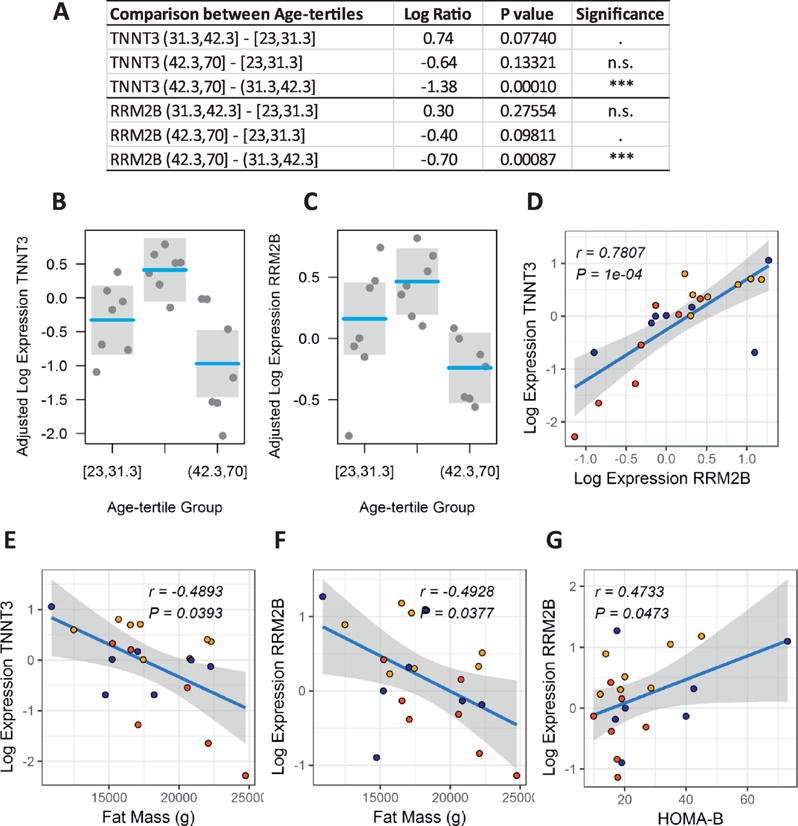
Figure 2.

Expression profiles of TNNT3 and RRM2B in human vastus lateralis muscle. Differential expression analysis by age-tertile group after adjustment for confounding effects of gender and BMI (A-C). Correlation plots between muscle expression levels of TNNT3 and RRM2B (D), TNNT3 and whole body fat mass determined by DXA (E), RRM2B and whole body fat mass determined by DXA (E), and between RRM2B and pancreatic β cell function as determined by the homeostasis model assessment of β cell function (HOMA-B) (G). Reported correlation coefficients r are adjusted for gender and BMI. Symbol colors in correlation plots represent the first age-tertile (blue), second age-tertile (orange), and third age-tertile (red) groups.
