
Figure 1.
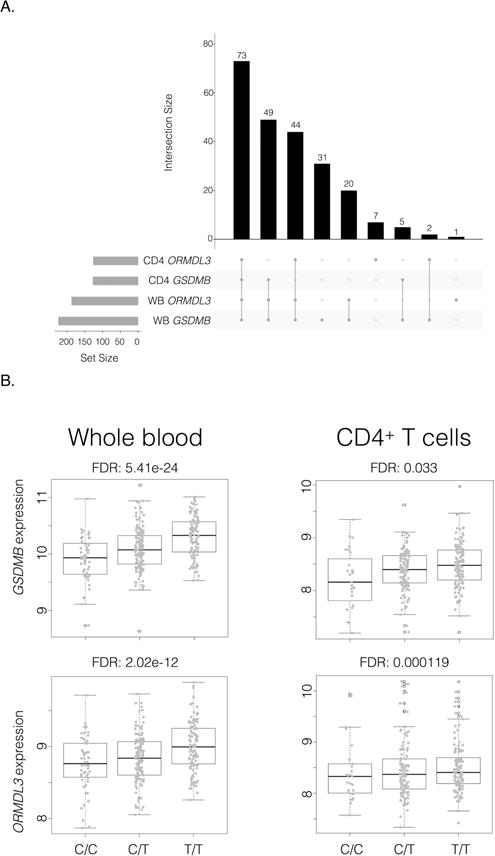
Summary of 17q21 eQTL analyses.
A. Main bar graph (black vertical bars) denotes counts of SNPs significantly associated (FDR < 0.05) with ORMDL3 or GSDMB expression in CD4+ T cells or whole blood (WB). The vertical gray line and dot graph directly underneath denotes the count of significant SNP common to combinations of tested groups, with combinations indicated by connected circles. The gray bar graph on the bottom left shows the number of eQTLs for the specified groups. Plot generated with upset function from “UpSetR” R package.
B. Box plots for gene expression for GSDMB (top) and ORMDL3 (bottom) according to rs7216389 genotype in whole blood (left; C/C [n=52], C/T [n=131], T/T [n=105]) and CD4+ T cells (right; C/C [n=27], C/T [n=115], T/T [n=122]).