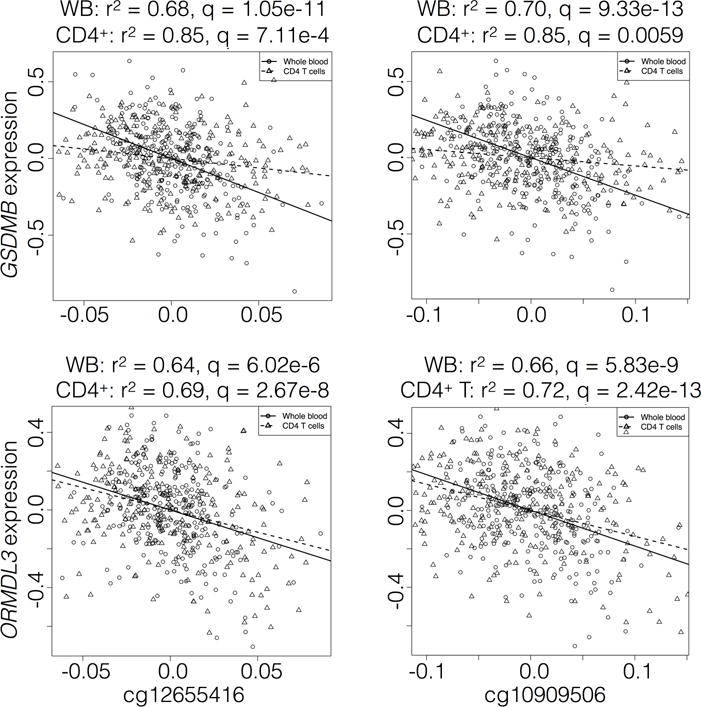
Figure 2.

Correlation of CpG methylation with GSDMB and ORMDL3 gene expression. Scatter plots of residuals, after adjusting for covariates, for gene expression of GSDMB (top panel) and ORMDL3 (bottom panel) and methylation of selected CpG sites in whole blood (black open circles) and CD4+ T cell (black open triangles) cohorts. Linear regression fits for whole blood (solid lines) and CD4+ T cell cohorts (dashed lines) are provided.
