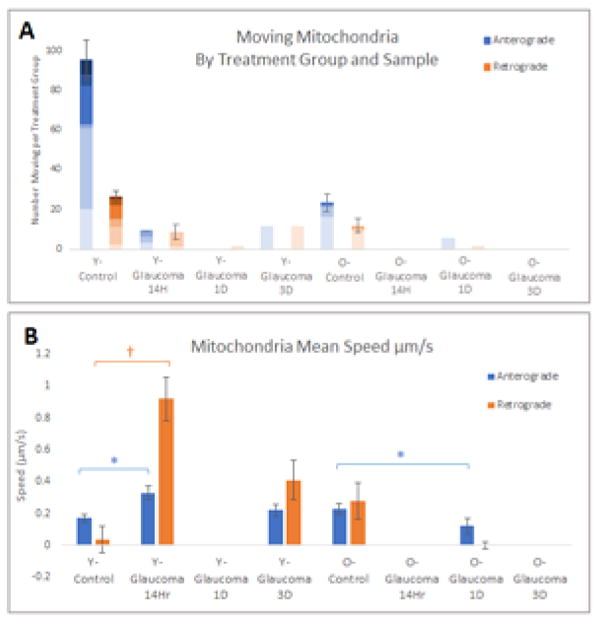
Figure 2.

A) The number of moving mitochondria for each explant sample within each treatment group separated by direction. Each shade represents a single explant. The blue bars represents mitochondria moving in the anterograde direction, the orange bars represent mitochondria moving in the retrograde direction. B) Mitochondrial mean speed by group. The blue bars represents mitochondria moving in the anterograde direction, the orange bars represent mitochondria moving in the retrograde direction. *= p-value is <0.05, †= p value is <0.01 using Bonferroni adjustment for multiple comparisons; (47 Eyes from 26 Mice). Mean values are the speed of mitochondria per 0.2 mm2 (200 μm by 100 μm image window).
