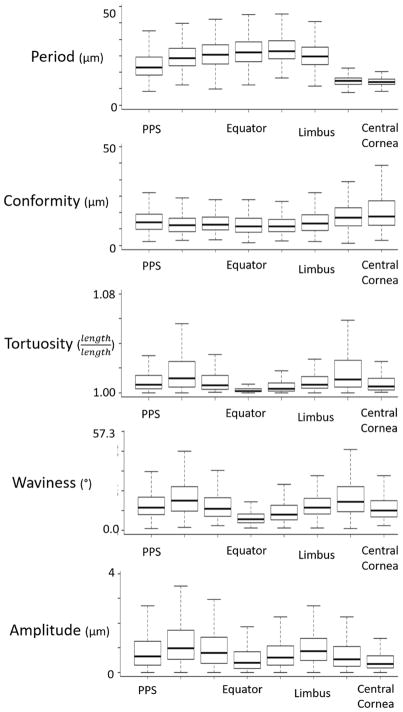
Figure 6.
Boxplots of the distribution of each crimp parameter in each region. The regions are ordered from posterior (PPS) to anterior (central cornea). Period and conformity had generally opposite trends while tortuosity, waviness, and amplitude had similar trends. Note that each box in the plots above represents between 100 and 1200 measurements.

