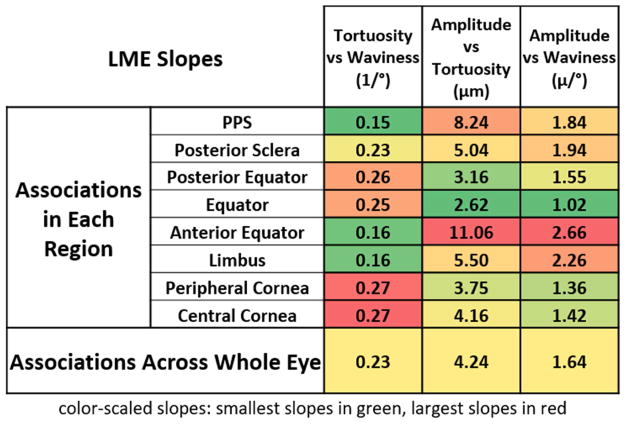
Figure 9.
The LME slopes of bundle-by-bundle crimp associations in each region. Tortuosity, waviness, and amplitude were all significantly associated with one another for each region and across all eyes. The numbers shown on the table are the slopes of the associations obtained from the linear mixed effect models. To simplify distinguishing trends, the cells are colored according to the magnitude of the slope. Largest in red, lowest in green. For tortuosity vs waviness, the largest slopes occurred in the cornea, whereas for amplitude vs tortuosity and amplitude vs waviness, the largest slopes occurred in the anterior equator.

