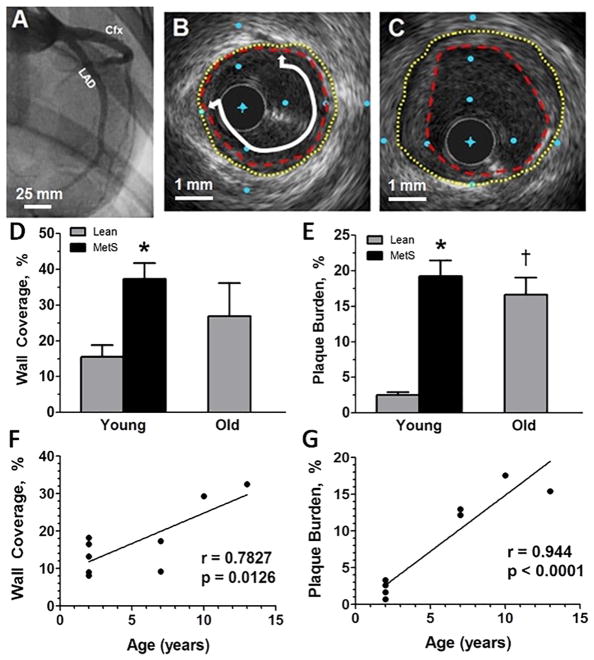
Figure 2. MetS young swine and lean old swine have comparable CAD severity as measured by intravascular ultrasound.
(A) Angiogram showing the LAD and Cfx coronary arteries from a lean young swine. (B) Cross sectional view of a lean old swine with mild disease. (C) Cross sectional view of a MetS young swine with more severe disease. (D) MetS young swine have higher percent wall coverage than lean young swine in the proximal 15 mm of the LAD. (E) MetS young and lean old swine have greater percent plaque burden compared to lean young swine. Both percent wall coverage (F) and percent plaque burden (G) are positively correlated to age in lean swine. Original lumen = yellow dotted line; plaque encroachment = red dashed line; wall coverage = white line with arrows. The distance between blue dots in B and C is 1 mm. *, p < 0.05 compared with lean swine; †, p < 0.05 compared with young swine. (Lean young = 6; MetS young = 10; Lean old = 5; MetS old = 3)

