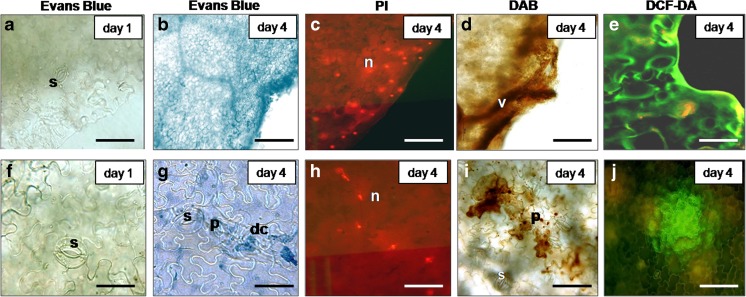
Fig. 5.
Wound-induced cell death response in lettuce fresh-cuts stored at 4 °C a Evans Blue stained cut edge; the lack of blue coloured tissue indicates a lack of dead cells day 1. b Evans Blue stained dead cells at the cut edge; note the blue stained tissue, day 4. c PI stained dead cells in vicinity to cut edge, day 4; note the PI positive (red fluorescing) condensed nuclei. d H2O2 accumulation in vicinity to cut edge, day 4; DAB staining; note the brown coloured deposits. e Accumulation of overall ROS in vicinity to cut edge, day 4. DCF-DA staining; note the green fluorescence. f Evans Blue stained bruised leaf area; no blue labeled dead cells are detected, day 1. g Evans Blue stained bruised area; visible are dead cells with shrunken protoplast (in blue), day 4. h PI stained nuclei (bright red fluorescence) in dead cells in bruised area, day 4. i H2O2 accumulation in cells with shrunken protoplasts in bruised area; note the brown DAB deposits, day 4. j ROS accumulation (green fluorescing cloud) in bruised area, day 4; DCF-DA staining. a, b, d, f, g and i Light microscopy; c, e, h and j Fluorescent microscopy. dc Dead cell, n Nucleus, p Protoplast, s Stoma, v Vessel. Scale bars = a–e, i and j 100 μm, f–h 50 μm

