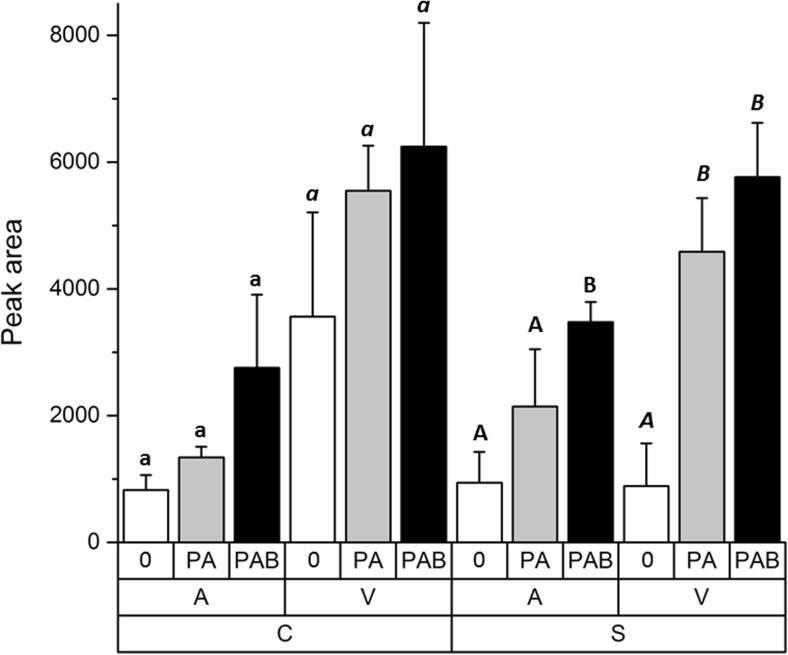
Fig. 3.
UV-absorbing phenolic compounds, illustrated as peak areas in Zygnema sp. C (C, left) and Zygnema sp. S (S, right). Pre-akinetes (A) are shown at the left side and vegetative cells (V) at the right side. The different treatments are indicated as follows: untreated control (0), PAR+UV-A (PA), and PAR+UV-A+UV-B (PAB). Statistical differences among individual UV treatments (one-way ANOVA, Tukey’s test) are marked with lower-case letters (Zygnema sp. C, pre-akinetes), lower-case letters in italics (Zygnema sp. C, vegetative cells), upper-case letters (Zygnema sp. S, pre-akinetes), or upper-case letters in italics (Zygnema sp. S, vegetative cells)

