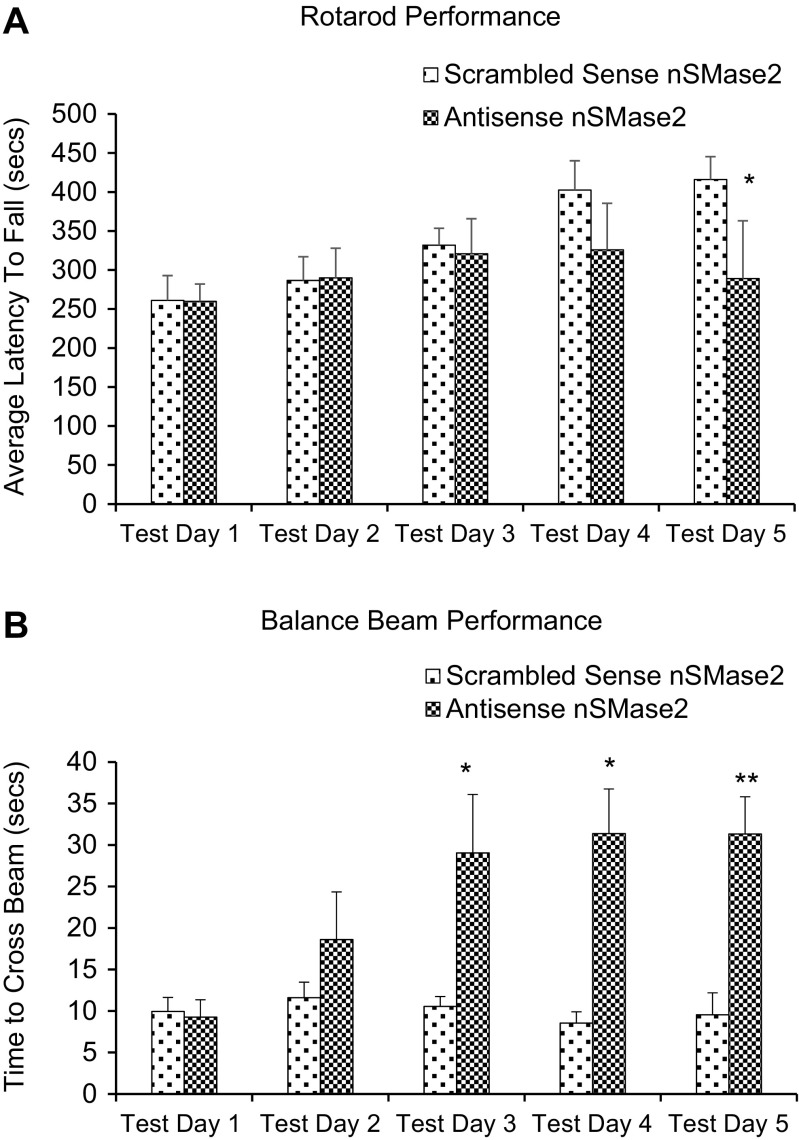
Fig. 8.
a Rotarod performance (scrambled sense vs antisense). The histograms represent the time spent by rats injected with scrambled sense nSMase2 and rats injected with antisense nSMase2 walking on the accelerating rotating rod. Animals were tested for 5 days post intrastriatal injection. Data represents the mean and standard error from n = 6 Wistar rats in each group. Each bar in the diagram indicates mean + SEM. b Beam crossing test (scrambled sense vs antisense). The histograms represent the time spent by rats injected with saline and rats injected with GW4860 to cross the beam. Rats that fell off the beam or were unable to cross the beam successfully after 60 s were given a maximum score of 60 s. Animals were tested for 5 days post intrastriatal injection. Data represents the mean and standard error from n = 6 Wistar rats in each group. Each bar in the diagram indicates mean + SEM. Asterisks indicate significant differences compared to controls: *p < 0.05, **p < 0.01, ***p < 0.001

