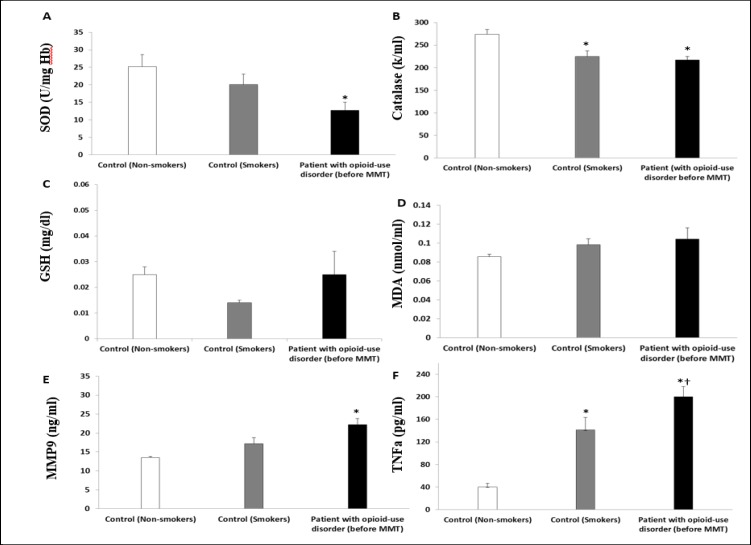
Figure 2.
Comparison of Erythrocyte Superoxide Dismutase (A), Catalase Activity (B), Glutathione (C), Plasma Malondialdehyde, MDA (D), Plasma MMP9 (E), Plasma TNF-α (F) in Non-smokers, Smokers and Patients with Opioids Use Disorder (before MMT). The Data Are Presented as Means ± SD. *P<0.05 Compared to the Non-smoker Comparison Group. †P<0.05 Compared to the Smoker Comparison Group

