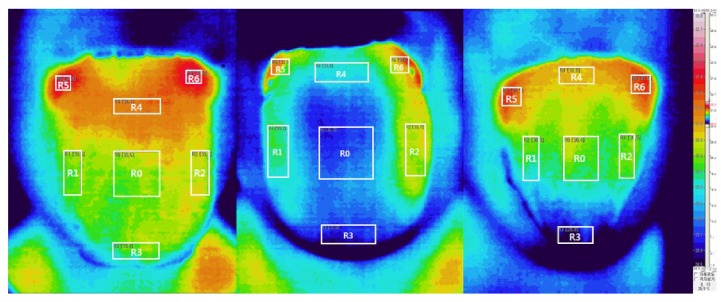
Figure 3.
Left: This patient showed lower scores for cold factor 2 (8 points) and heat factor 2 (6 points). The temperatures of RA, RB, and RC (33.4°C, 33.8°C, and 35.0°C, respectively) were higher than average (RA: 32.2°C, RB: 33.0°C, and RC: 34.1°C). Middle: This patient recorded higher scores for both cold factor 2 (13 points) and heat factor 2 (8 points). The temperatures at RA, RB, and RC were lower than average (32.0°C, 33.1°C, and 34.0°C). Right: The tongue temperature at RA (28.8°C) was markedly lower than that in the other participants. Moreover, the temperatures at RB and RC were lower than average (30.6°C and 31.5°C, respectively). The patient showed higher scores for cold factor 2 (14 points). RA: R3; RB: R0, R1, R2, and R4; RC: R5 and R6. Note that all colors were adjusted using the same thermographic scale, which is shown on the rightmost side of the figure.

