Figure 5.
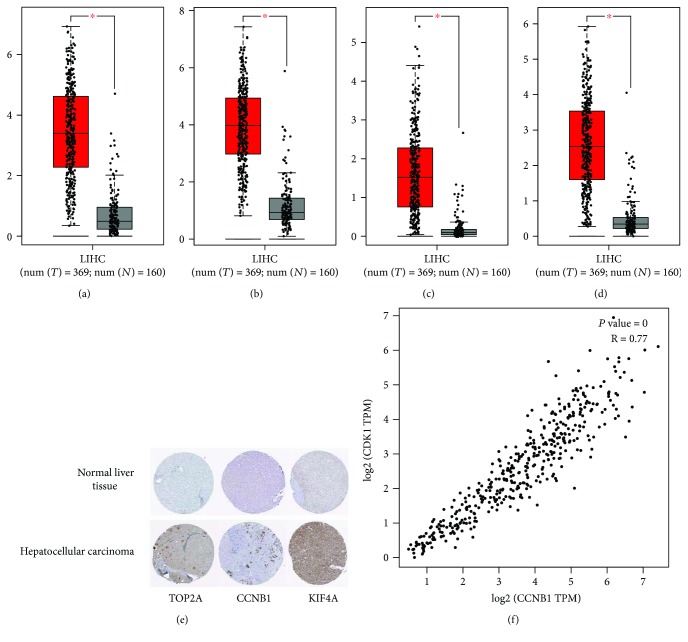
(a–d) Expression level of TOP2A, CCNB1, KIF4A, and CCNB2 in HCC and normal tissues. Number (T = 369, N = 160); ∗P < 0.05. (e) TOP2A, CCNB1, and KIF4A protein were strongly upregulated in HCC tissues compared with normal liver tissues based on The Human Protein Atlas database. The normal liver tissue of TOP2A was from a female, aged 32, (patient ID: 1846; staining: not detected; intensity: negative; quantity: negative; location: none), and the HCC tissue was from a male, aged 80 (patient ID: 2280; staining: low; intensity: moderate; quantity: <25%; location: cytoplasmic/membranous nuclear). The normal liver tissue of CCNB1 was from a female, ages 63, (patient ID: 3222; staining: not detected; intensity: negative; quantity: negative; location: none), and the HCC tissue was from a female, aged 41, (patient ID: 5037; staining: moderate; intensity: weak; quantity: <25%; location: cytoplasmic/membranous nuclear). The normal liver tissue of KIF4A was from a female, aged 54 (patient ID: 3402; staining: not detected; intensity: negative; quantity: negative; location: none), and the HCC tissue was from a male, aged 67, (patient ID: 3477; staining: moderate; intensity: moderate; quantity: >75%; location: cytoplasmic/membranous nuclear). (f) The correlation analysis between CCNB1 and CDK1. CCNB1 and CDK1 are obviously positively correlated.

