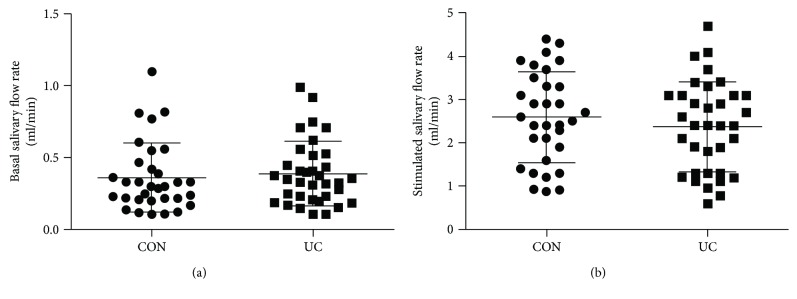
Figure 1.
Comparable salivary fluid secretion between controls and UC patients. (a) Comparison of the basal SFR (ml/min) between controls (CON; n = 32) and UC patients (n = 35). (b) Comparison of the stimulated SFR. Values are means, with SD represented by vertical bars. No significant difference was obtained for basal or stimulated SFR between the study groups.

