
Figure 8.
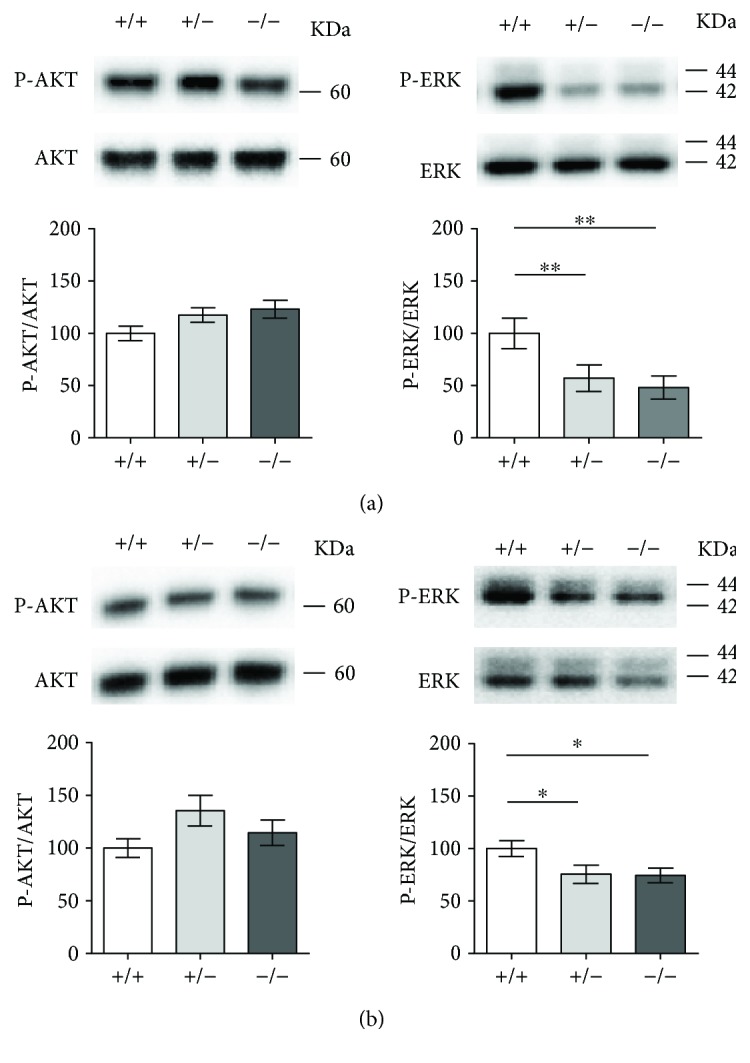
Altered ERK signaling pathway in Cdkl5 +/− female mice. (a) Western blot analysis of P-AKT-Ser 473 levels normalized to total AKT levels (left histograms) and P-ERK-Ser 42–44 levels normalized to total ERK levels (right histograms) in the hippocampus (a) and cerebellum (b) of Cdkl5 +/+ (n = 6 and n = 5, resp.), Cdkl5 +/− (n = 6 and n = 8, resp.), and Cdkl5 −/− (n = 6 and n = 5, resp.) mice. Immunoblots are examples from one animal of each experimental group. Data are expressed as a percentage of the values of Cdkl5 +/+ mice. Values are represented as means ± SE. ∗ p < 0.05 and ∗∗ p < 0.01 (Fisher's LSD after ANOVA).