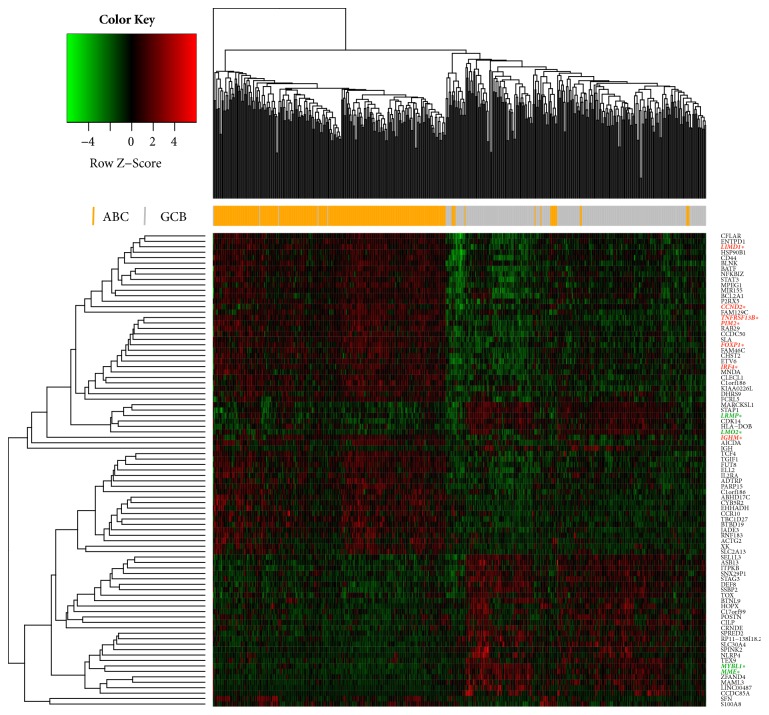
Figure 1.
Heatmap of the DEGs. Each raw read represents a single gene, and each column represents a tissue sample. The gradual color change from green to red represents the shift from ABC-upregulated to ABC-downregulated genes. This analysis revealed 87 DEGs that were significantly different between the ABC and GCB tissues. ∗COO common markers are in red (ABC-markers) or green (GCB-markers).

