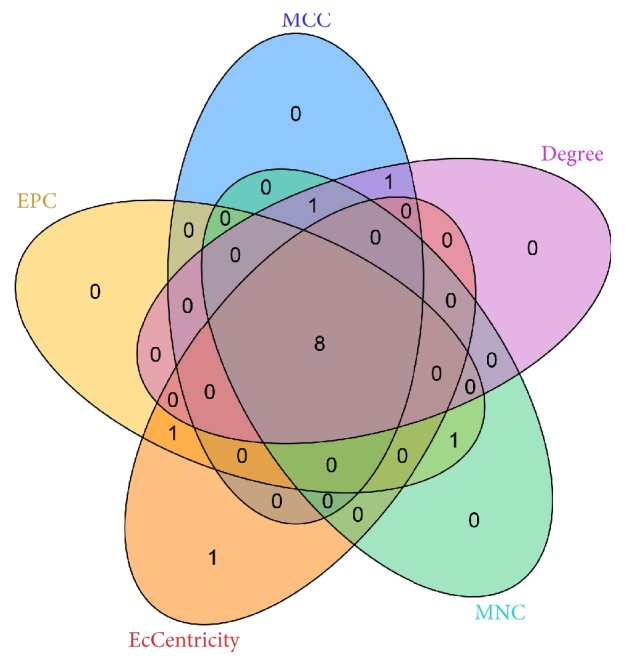
Figure 5.

Employing an online resource, we used five intersecting algorithms to generate a Venn plot to identify significant hub genes. Areas with different colors correspond to different algorithms. The cross areas indicate the commonly accumulated DEGs. The elements in concurrent areas are the 8 hub genes (MME, CD44, IRF4, STAT3, IL2RA, ETV6, CCND2, and CFLAR).
