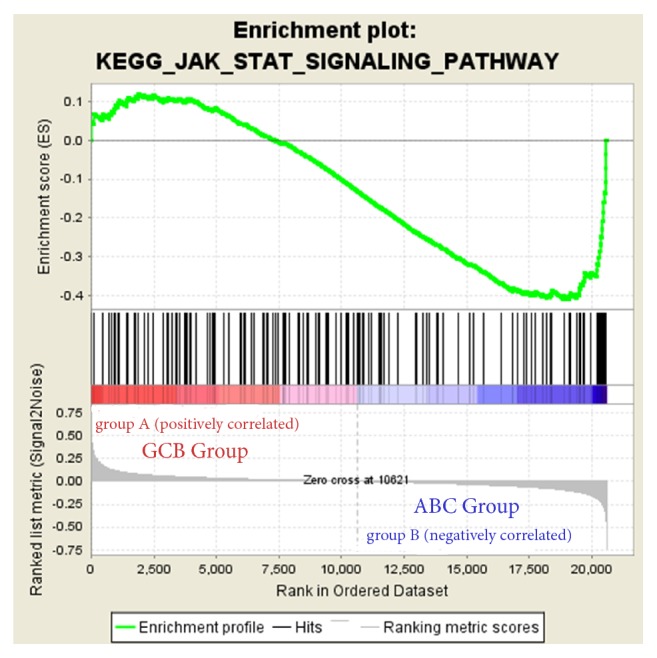
Figure 8.

GSEA analysis revealed that ABC-upregulated genes were enriched in the JAK-STAT signaling pathway (ES = -0.41, NOM p value = 0.006, FDR = 0.208, and FWER p value = 0.775). A positive enrichment score (ES) indicated correlation with the first group (GCB) and a negative ES indicated correlation with the second group (ABC).
