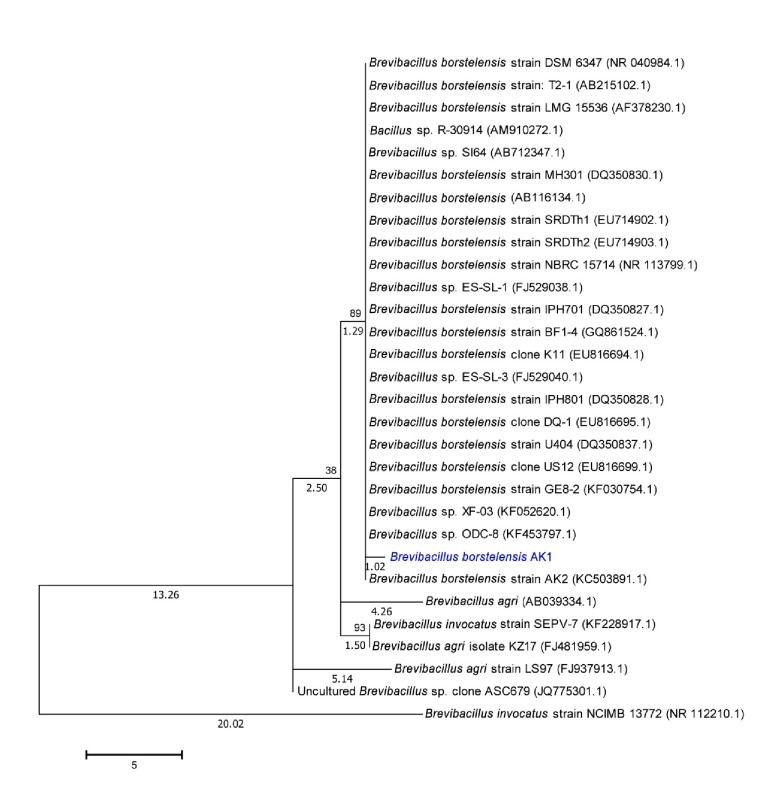
Figure 2.
Molecular Phylogenetic analysis by Maximum Likelihood method highlighting the position of Brevibacillus borstelensis AK1 relative to other similar bacteria. Bootstrap values based on 1000 replicates show the robustness of the branching. Scale bar represents 0.1 substitutions per nucleotide position. The tree is drawn to scale, with branch lengths measured in the number of substitutions per site.

