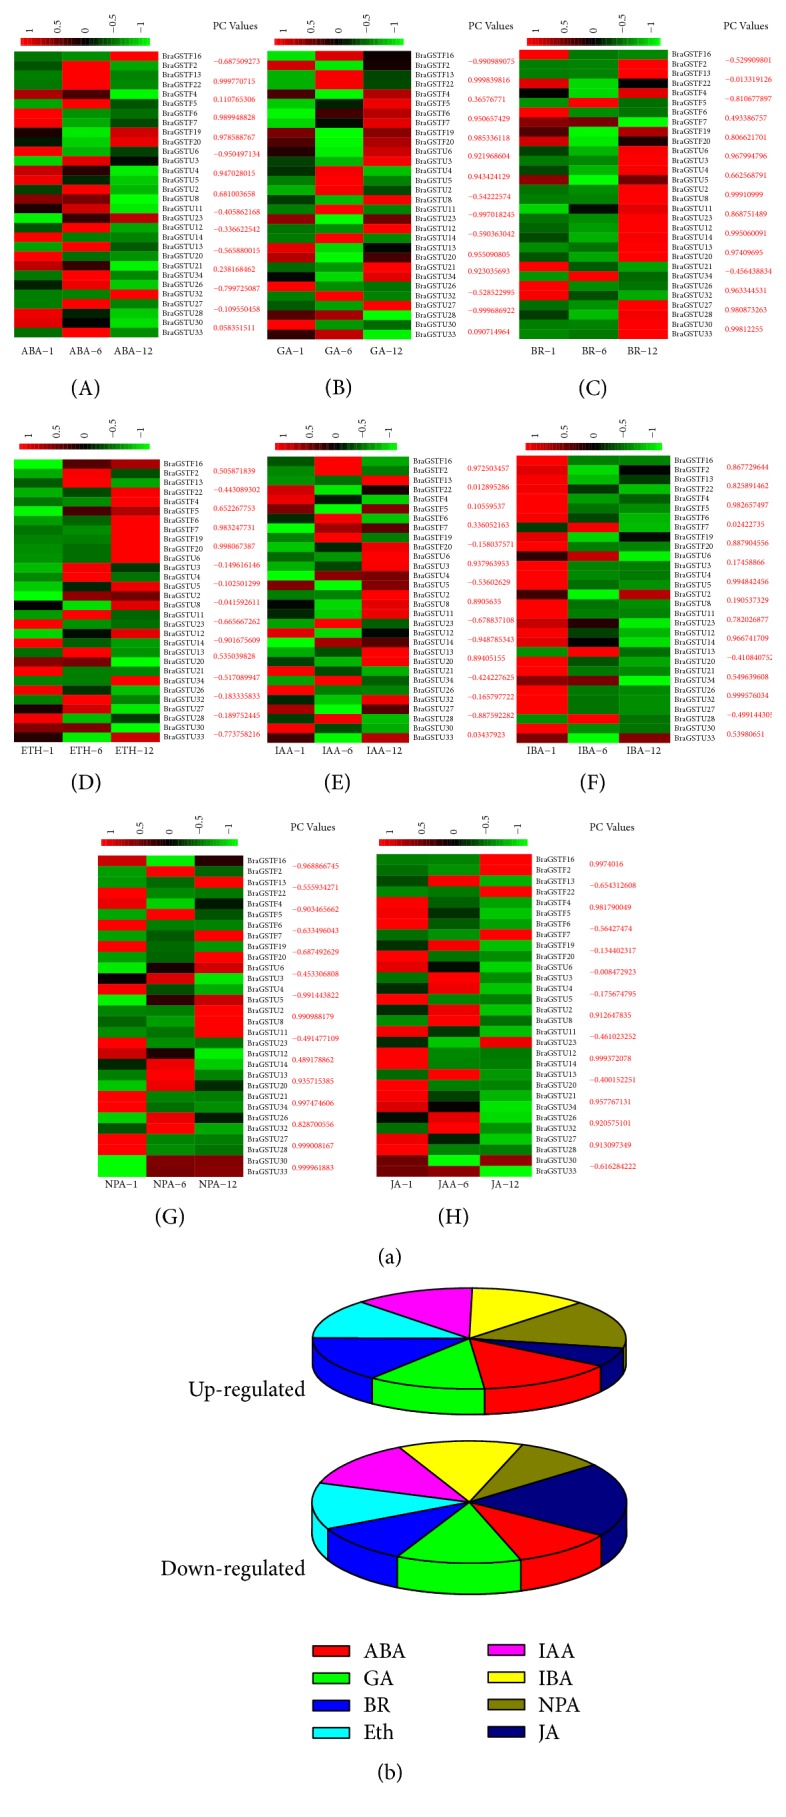
Figure 9.

(a) Expression analysis of the BraGST genes under eight multiple hormonal treatments in B. rapa (A–H). Heatmap representation of the BraGST genes under eight multiple treatments, namely, ABA, GA, BR, ETH, IAA, IBA, NPA, and JA. For each pair of BraGSTs their PCC values are also displayed. (b) Showing the up- and downregulated genes in response to multiple treatments.
