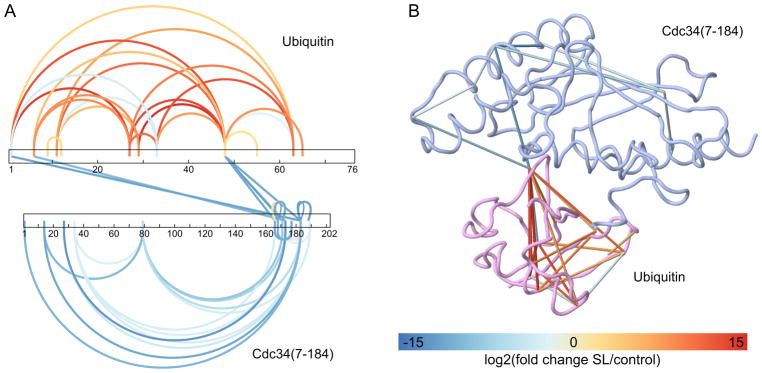
Figure 4. Visualization of cross-link abundance fold changes obtained by quantitative proteomics.
Label-free quantification of cross-linked peptides with xTract was done to evaluate the effect of 1% sodium laurate (SL) detergent solution on Cdc34/ubiquitin complex structure. Variation in cross-link abundance can be visualized in CLMSVault with either the modified xiNET (A) or our 3D viewer (B) with the fold change color scheme. Cross-links not quantified were omitted for clarity. Cross-links with a t-test significance ≤ 0.05 are displayed.

