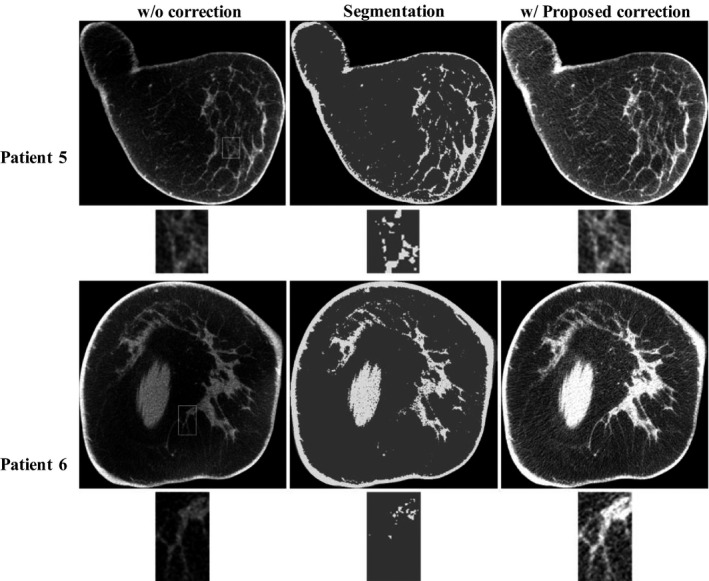
Figure 4.

The effect of segmentation errors on the performance of the proposed correction method. For each patient, the images on the top panel are the uncorrected image, the corresponding tissue segmentation and the corrected image using proposed method. The bottom panel shows the zoom‐in views of the selected ROI (marked as white squares in the top panel) on the corresponding image above. Display window: [0.2 0.3] cm−1.
