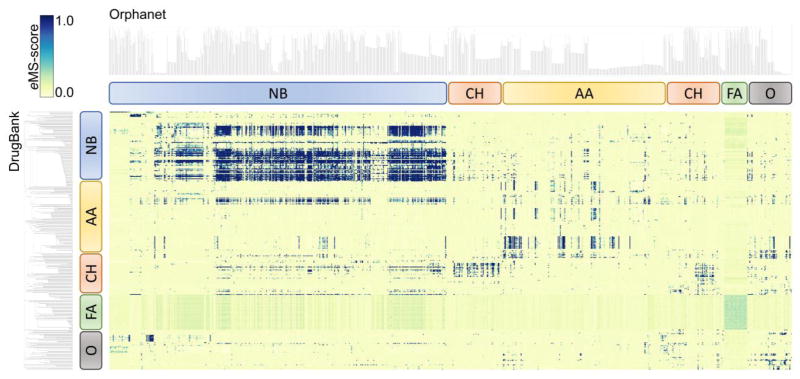
Figure 2.
Heat map visualizing all-against-all binding site matching between DrugBank and Orphanet proteins in eRepo-ORP. Binding pocket similarity is quantified with the eMS-score according to the color scale displayed in the top-left corner. DrugBank and Orphanet proteins are hierarchically clustered by the chemical similarity of their ligands with the resulting dendrograms shown on the left side and at the top of the heat map, respectively. Rounded rectangles identify distinct groups of proteins binding compounds containing nitrogen bases (NB, blue), carbohydrates (CH, red), amino acids (AA, yellow), fatty acids (FA, green), and other molecules (O, gray).

