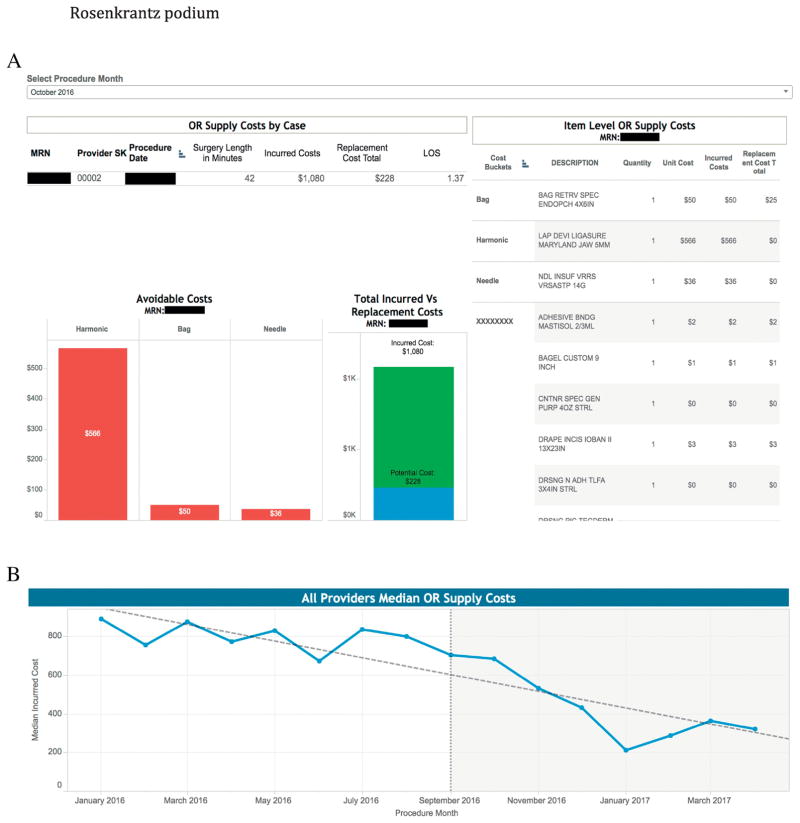
Figure 1.
Representative views of Tableau dashboard to visualize data for appendectomy cost reduction intervention. (A) Dashboard visualization of OR supply costs for a single case, along with individual supply costs and avoidable costs, representing opportunities for cost reduction. (B) Dashboard visualization showing the reduction in overall median OR supply costs before and after intervention.

