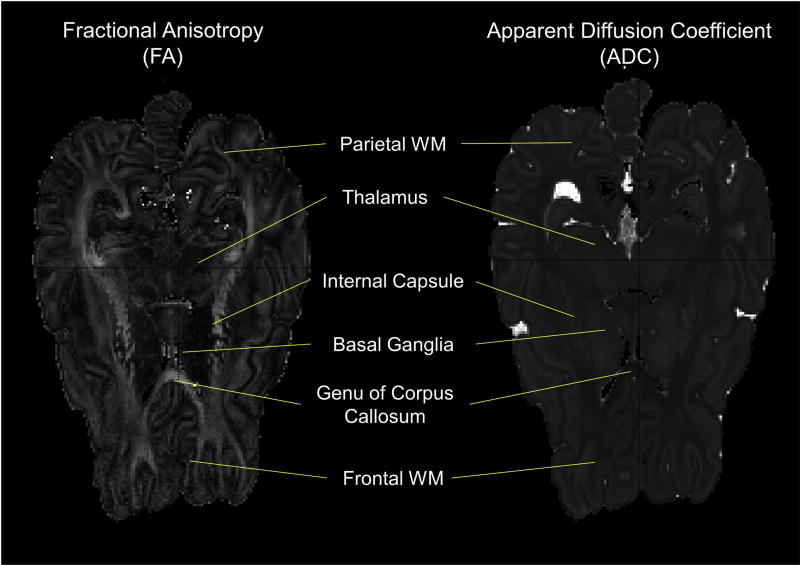
Figure 2. Example Fractional Anisotropy (FA) and Apparent Diffusion Coefficient (ADC) maps.
The FA and ADC maps shown represent the same axial slice from a Late Tissue Control (TC) lamb. ADC values were determined from regions of interest (ROI) from bilateral gray matter (GM) structures (basal ganglia and thalamus) and white matter (WM) structures (Frontal WM, Parietal WM, Internal Capsule, Genu of Corpus Callosum). FA values were determined from ROI from the aforementioned WM structures as well. Not pictured in these slices are the WM structures Splenium of the Corpus Callosum and the Cerebral Peduncles, from both of which ADC and FA values were determined as well.

