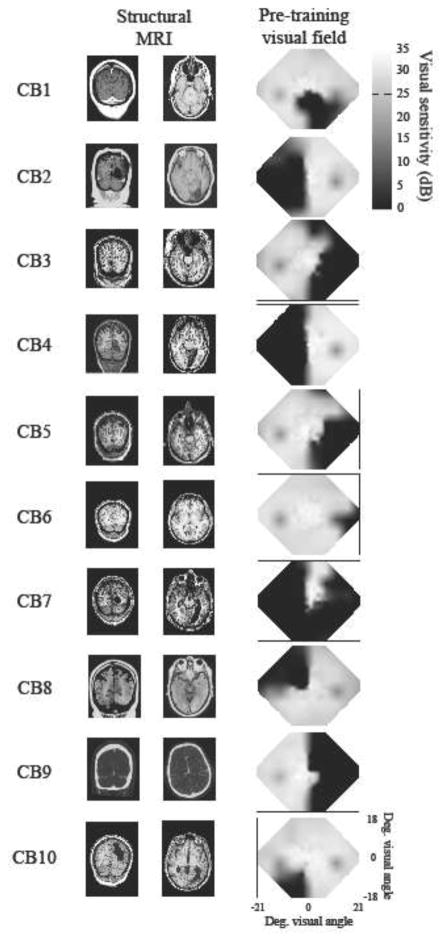
Figure 1. Brain scans and visual fields of CB subjects.
A. T1-weighted MRI images for CB1–7 and CB9–10, and CT images for CB8 (for whom MR images were unavailable) showing lesion locations. Left is left and right is right on each picture. B. Composite baseline visual fields. Areas of relative vision are indicated by white to grey shading, while relative blindness is shown in black. Composites fields were created by plotting luminance detection values obtained from 24-2 and 10-2 Humphrey visual field tests into a matrix (as in Cavanaugh and Huxlin, 2017). If these locations coincided, the dB values were averaged together. Two-dimensional interpolation between tested data points then filled the empty spaces between values. All values are measured in dB (scale bar on far right).

