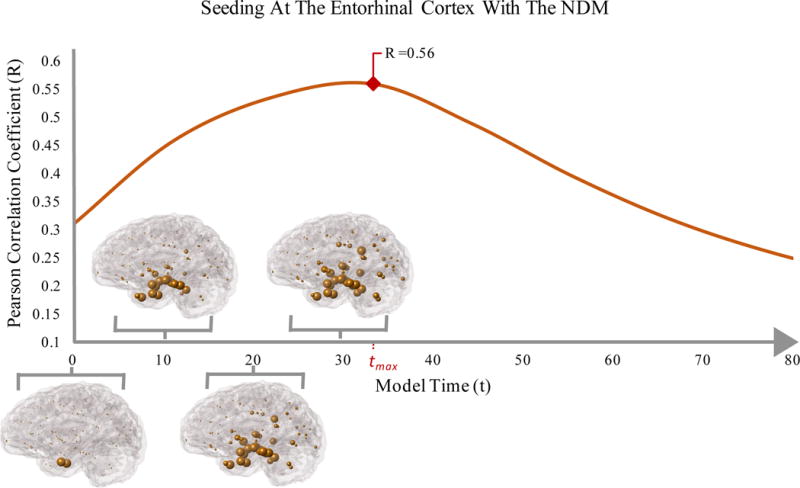
Figure 2.

Glass Brain representation of NDM predicted atrophy over time (t). The blue spheres depict the affected regions and indicate a propagation of AD pathology that can be partially recapitulated by a single regional seed at the entorhinal cortex of the NDM. Regional seeding with the NDM propagates into atrophy patterns that have a high correspondence to cross-sectional atrophy of AD patients. Seeding for all regions were conducted; however, the figure represents seeding at the Entorhinal Cortex which resulted in a high correlation strength (Rmax = 0.56, p = 2.03 E-08).
