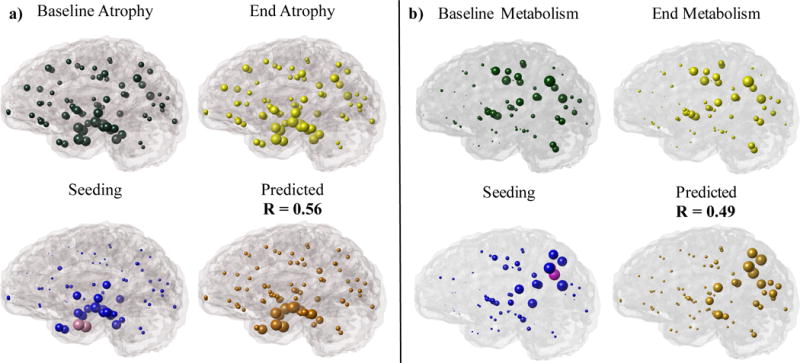
Figure 3.

Glass Brain representations of (a) cross-sectional atrophy and (b) metabolism for ADNI patients at the start and end of study are indicated in green and yellow, respectively. Regional seeding of the NDM at 86 regions of interest are indicated in pink and blue spheres. Pink spheres represent bilateral seeding of the (a) EC and (b) Precuneus with the highest correlation strength while blue spheres indicate other regions with lower correlation strengths. Orange indicates the NDM predicted pathology from the best time point, x(tmax), which highly correlated with observed (a) cross-sectional atrophy measurements, R = 0.56 (p = 2.03E-08) and (b) metabolism from FDG-PET measurements, R = 0.49 (p = 2.01E-06).
