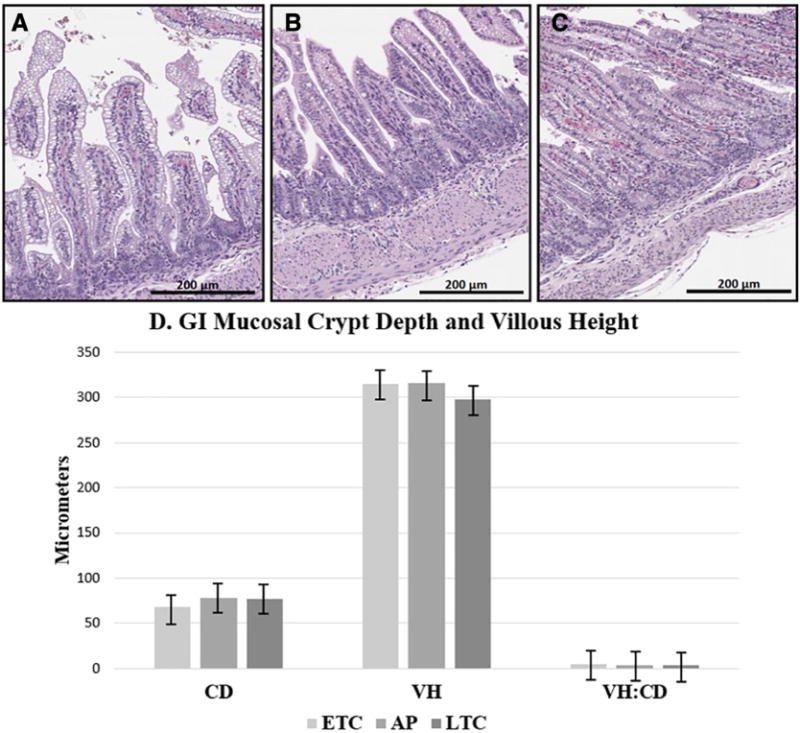
Fig. 2.

Representative histological images and graph comparing GI morphology of all groups. (A) ETC [H&E Stain]; (B) AP [H&E Stain]; (C) LTC [H&E Stain]; H&E, 200x magnification; (D) Graph demonstrating no significant difference when comparing Crypt Depth (CD), Villus Height (VH), or VH:CD Ratio of all groups. ETC: Early Tissue Control; AP: Artificial Placenta; LTC: Late Tissue Control. P-values calculated by ANOVA. * Indicates significance p<0.05.
