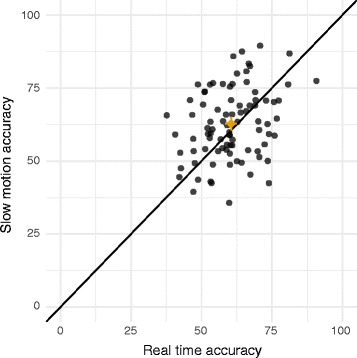
Fig. 2.

Scatterplot of the individual accuracy data in percentage. The accuracy for the slow-motion condition is plotted against the accuracy for the real-time condition. Dots indicate individual referees and the solid line indicates the identity line. The orange dot indicates the mean accuracy across referees. The orange lines indicate bootstrapped 95% confidence intervals for the mean accuracy in both conditions
