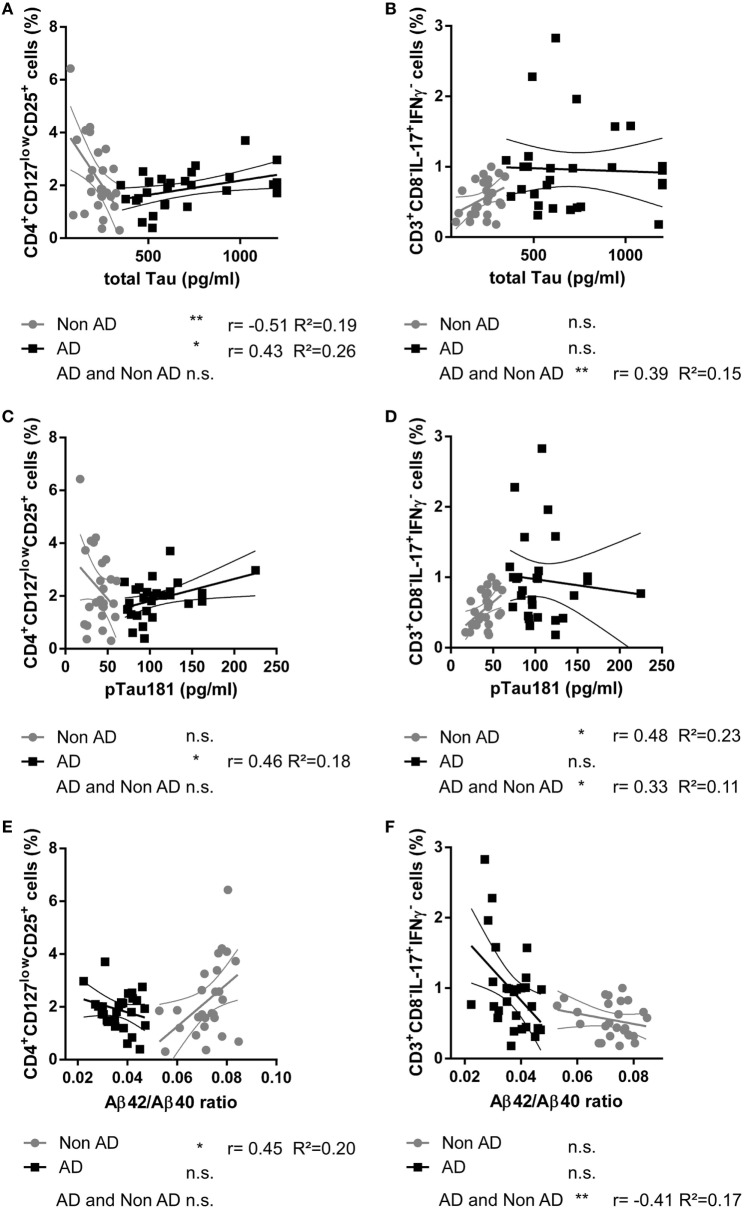
Figure 2.
Scatter plots showing the relationship between the cerebrospinal fluid level of total Tau protein [pg/ml; (A,B)], pTau181 [pg/ml; (C,D)], Aβ42/Aβ40 ratio (E,F), and the percentage of CD4+CD127lowCD25+ Tregs (A,C,E) and CD3+CD8−IL-17+IFNγ− Th17 cells (B,D,F) in donors with Alzheimer’s disease (AD, black squares) and controls (nonAD, gray dots). The associations in AD group, nonAD group and all subjects combined were investigated with Spearman’s correlation. (Scatter plots with the linear regression lines for AD and nonAD groups and their 95% confidence intervals are shown; non-significant = n.s., *p < 0.05, **p < 0.01, **p < 0.001; r: Spearman’s correlation coefficient; R2: coefficient of determination.)

