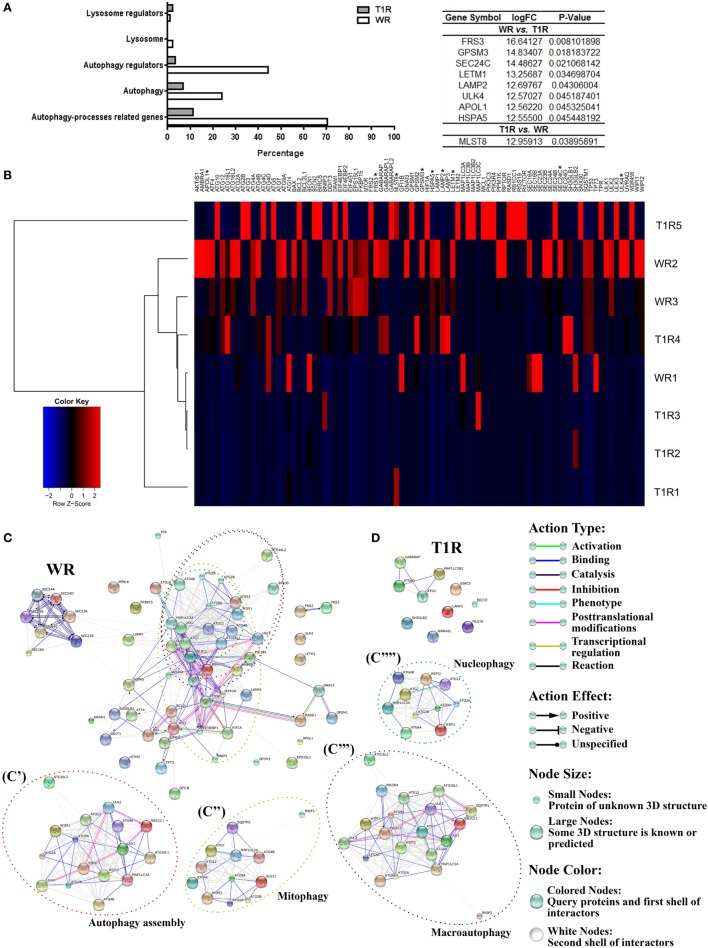
Figure 2.
Gene-expression profile of leprosy lesions showed a modulation of autophagy-associated genes between multibacillary patients who developed (T1R) or not (WR) reversal reactional episodes in the future. Purified mRNAs from skin lesions of multibacillary patients who developed (T1R) or not (WR) reversal reactional episodes were analyzed by RT-qPCR autophagy array. (A) Differentially expressed autophagy processes-related genes were sub-categorized. The expression fold values of the significantly upregulated genes in WR and T1R lesions were tabulated (full data are available in Table S3 in Supplementary Material). The threshold for statistical significance was p < 0.05. (B) Heat map showing analysis of differential expression of autophagy processes-related genes in leprosy patients. Each row represents one donor. Asterisks indicate genes with differential expression. Heat map data are representative of three WR and five T1R samples. (C,D) Autophagy gene interaction network in WR and T1R skin lesions. Genes with a differential expression in leprosy lesions according to autophagy PCR array analysis were visualized by STRING. The action network view. In this view, colored lines and arrow styles between genes indicate the various types of interactions. Network nodes represent genes. Edges represent gene–gene associations. Interactions among autophagy processes-related genes were more evident in WR than T1R patients. (C) Interactions in genes annotated to autophagy assembly (C′), mitophagy (C″), macroautophagy (C′″), and nucleophagy (C″″) ontology terms in WR group patients are shown. Interaction maps are representative of three WR and five T1R samples.

