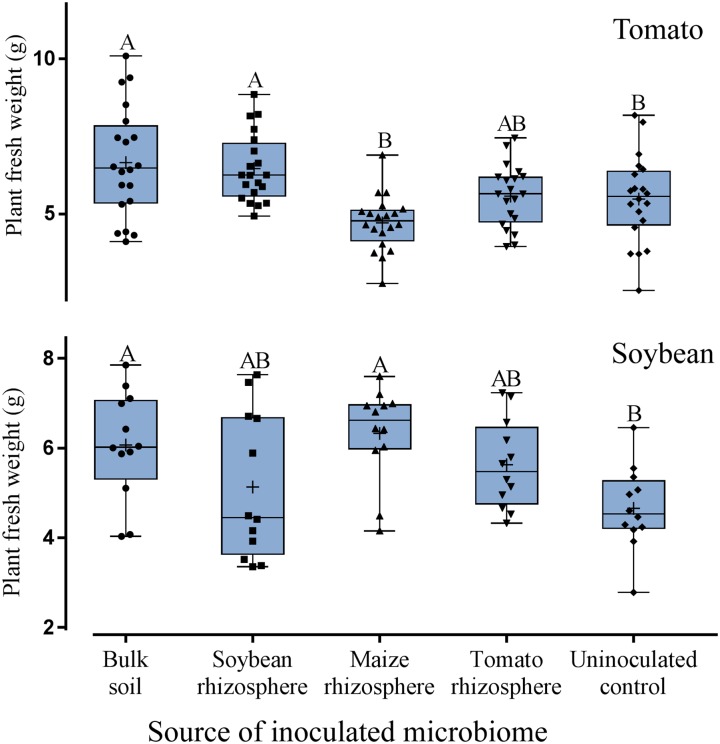
FIGURE 6.
Effect of microbiomes transplanted from the rhizospheres of different donor crops or bulk soil on the weight of tomato plants (upper panel, n = 10) or soybean plants (lower panel, n = 12). Mean numbers are shown as (+) for each treatment, medians are shown as (—), whiskers represent quartiles. Different letters indicate significant differences among treatments in Tukey’s test.

