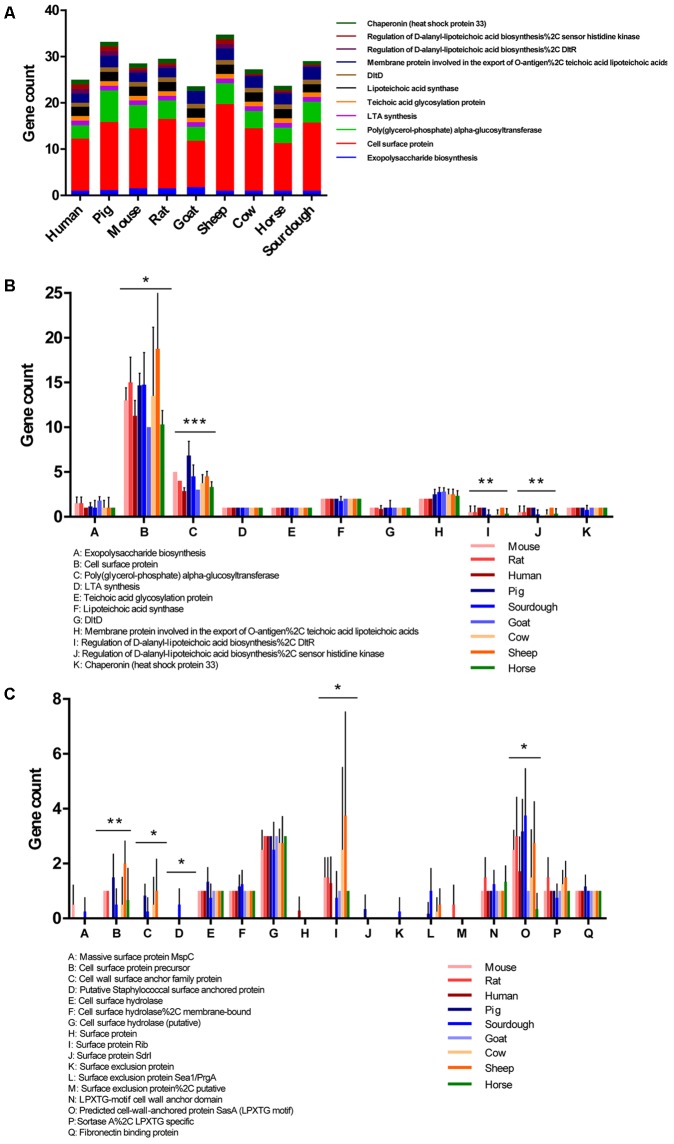
FIGURE 6.
Distribution and abundance of genes related to epithelial adhesion in nine host isolates. (A) Total count of adhesion genes in the nine host isolates. (B) Differential abundance of adhesion genes in strains isolated from nine isolates. (C) Differential abundance of cell surface protein-encoding genes in strains isolated from nine hosts. ∗p < 0.05, ∗∗p < 0.01, ∗∗∗p < 0.001.

