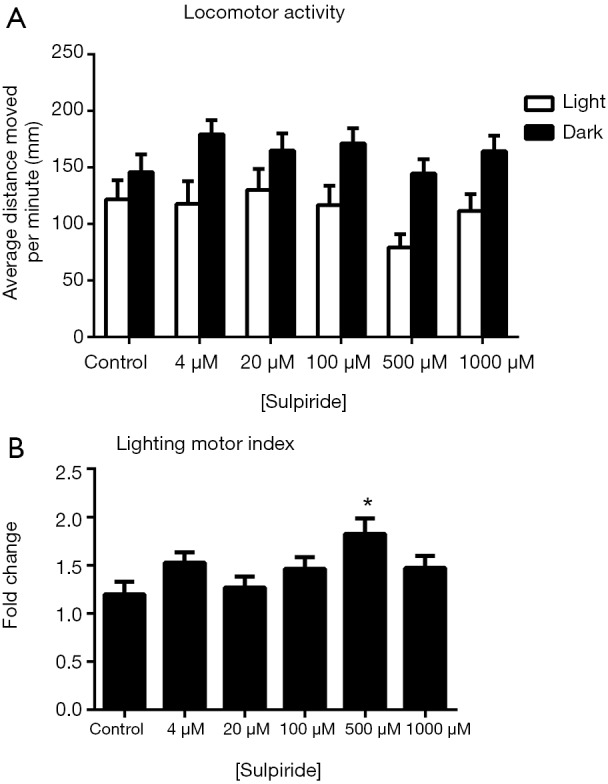
Figure 1.

Effects of sulpiride on zebrafish locomotor activities (A) and the lighting motor index (B). (A) Average distances moved by zebrafish larvae within a 1-min time bin are plotted. The horizontal axis denotes the sulpiride treatment concentration that the larvae received. The vertical axis denotes the distance moved by the zebrafish larvae in millimeters; (B) lighting motor index. The horizontal axis denotes the sulpiride treatment concentration that the larvae received. The vertical axis denotes the fold changes in the zebrafish locomotor activities under different illumination conditions. The data are presented as the mean ± SEM; n=32 animals per group. *, P<0.05, significantly differs from the control group. SEM, standard error of the mean.
