
Figure 4.
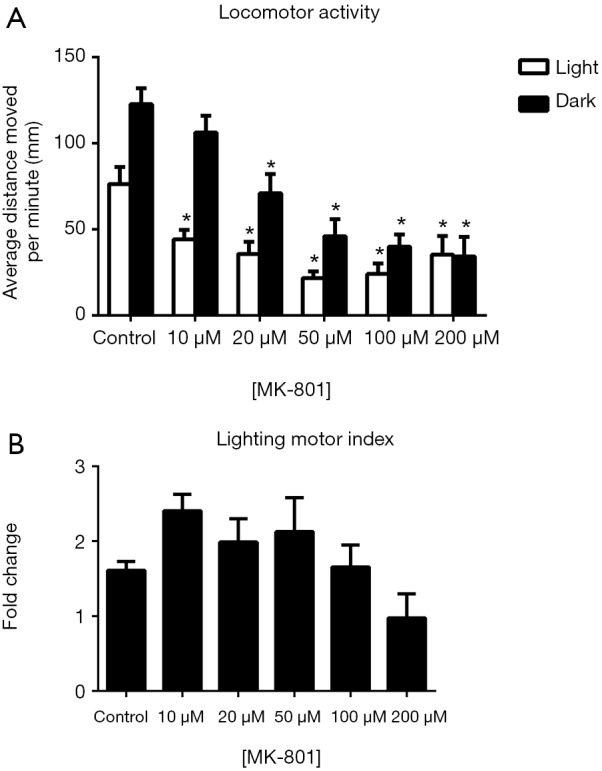
Effects of MK-801 on zebrafish locomotor activities (A) and the lighting motor index (B). (A) Average distances moved by the zebrafish larvae within a 1-min time bin are plotted. The horizontal axis denotes the MK-801 treatment concentration that the larvae received. The vertical axis denotes the distance moved by the zebrafish larvae in millimeters; (B) lighting motor index. The horizontal axis denotes the MK-801 treatment concentration that the larvae received. The vertical axis denotes the fold changes in the zebrafish locomotor activities under different illumination conditions. The data are presented as the mean ± SEM; n=32 animals per group. *, P<0.05, significantly differs from the control group. SEM, standard error of the mean.