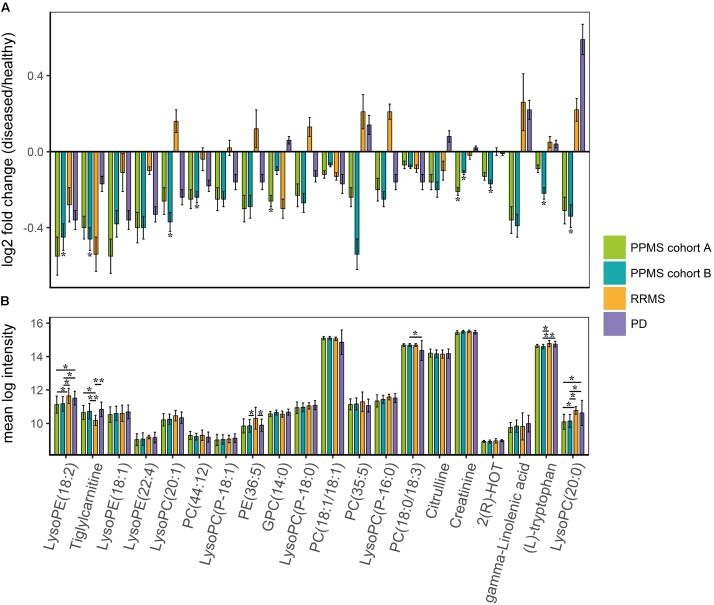
FIGURE 2.
Metabolites contributing to the specific PPMS signature. Twenty features (i.e., metabolites) with VIP scores > 1 for components 1 and 2. (A) Summary with respective log2 fold changes (diseased/healthy). Green: PPMS cohort A, blue: PPMS cohort B, orange: RRMS, and purple: PD. ∗Significant change (Welch’s t-test FDR ≤ 0.05), log2 fold change > 0: upregulation, log2 fold change < 0: downregulation. Error bars indicate standard deviations. (B) Comparison of PPMS patients from cohort A (green) and PPMS patients from cohort B (blue) to RRMS (orange) and PD (purple) patients. ∗Significant change (one-way ANOVA with Tukey’s post hoc test p ≤ 0.05 (∗∗p ≤ 0.01), p-value adjusted for multiple comparisons).

