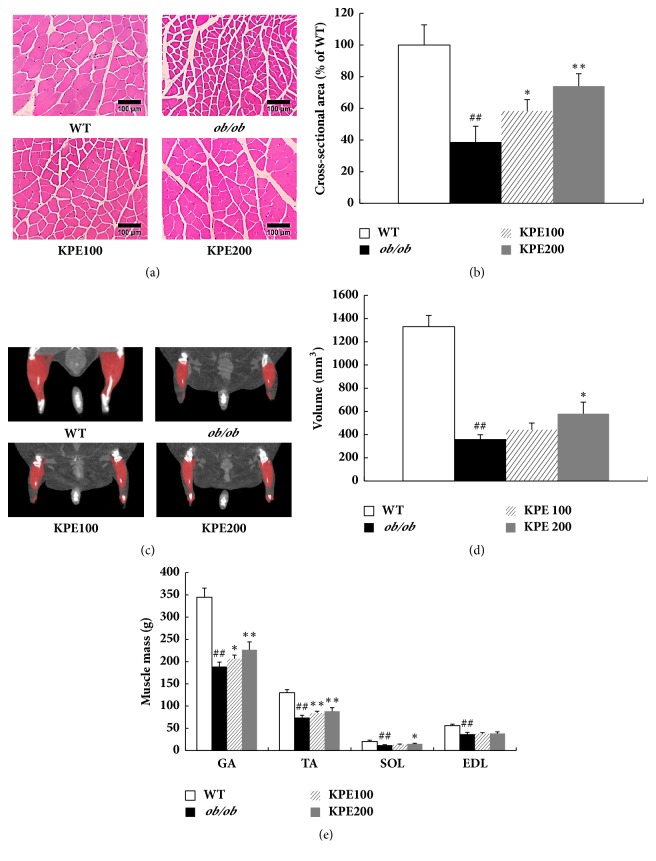
Figure 5.
Effect of KPE on muscle fiber size, hindlimb muscle volume, and muscle weights. (a) Representative H&E stain of gastrocnemius muscle fibers (magnification, ×200). (b) Gastrocnemius muscle fiber cross-sectional area. (c) Microcomputed tomography images of hindlimb muscle. (d) Hindlimb muscle volume. (e) Weights of gastrocnemius (GA), tibialis anterior (TA), soleus (SOL), and extensor digitorum longus (EDL) muscles. ##p < 0.01 compared to saline-treated WT group; ∗p < 0.05 and ∗∗p < 0.01 compared to saline-treated ob/ob group.

