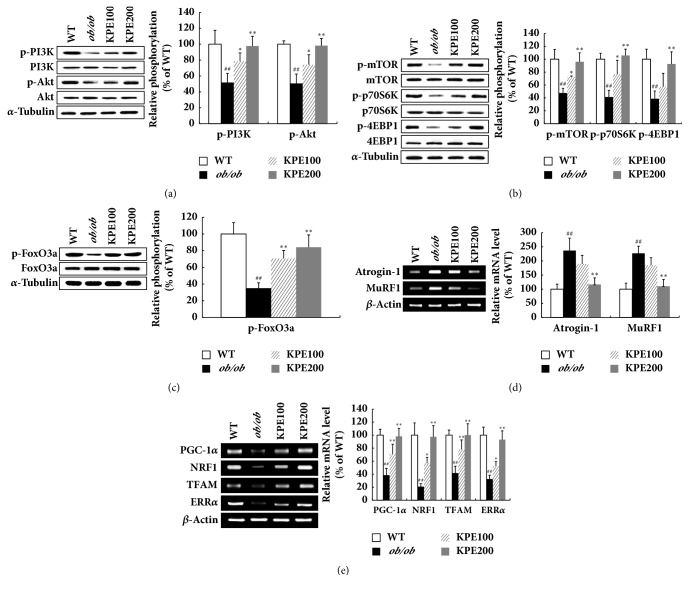
Figure 6.
Effect of KPE on PI3K/Akt pathway in gastrocnemius muscle. (a) Relative phosphorylation of PI3K and Akt. (b) Relative phosphorylation of mTOR, p70S6K, and 4EBP1. (c) Relative phosphorylation of FoxO3a. (d) Relative mRNA levels of Atrogin-1 and MuRF1. (e) Relative mRNA levels of PGC-1α, NRF1, TFAM, and ERRα. ##p < 0.01 compared to saline-treated WT group; ∗p < 0.05 and ∗∗p < 0.01 compared to saline-treated ob/ob group.

