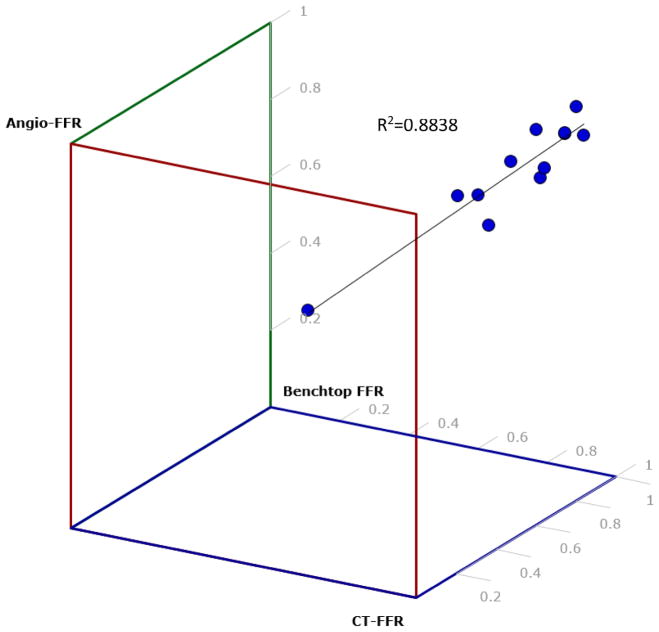
Figure 11.
A 3D scatter plot was created to determine the correlation between Angio-FFR, Benchtop FFR, and CT-FFR. Each dot represents a patient from out study. R2=0.88 which shows that the data is lightly fitted to the line of regression. This estimates a strong relationship between the linear model and the response variable.

