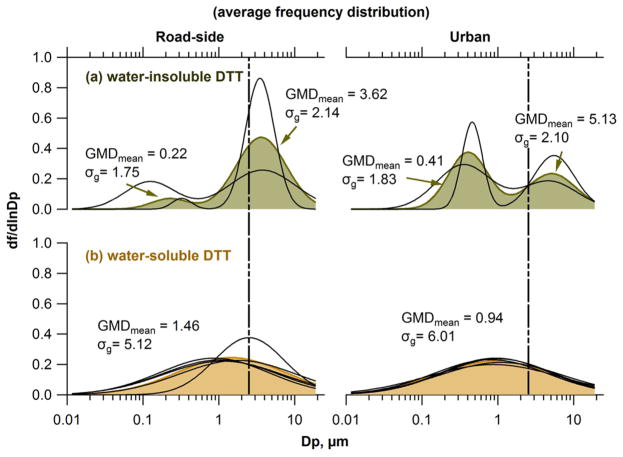
Figure 2.
Averaged frequency distributions of (a) water-insoluble DTT and (b) water-soluble DTT activities at a roadside site (RS, left panels) and an urban background (GT, right panels) in Atlanta, GA, USA. The vertical dotted line is aerodynamic diameter Dp = 2.5 μm. GMDmean and σg are the mean of the fit geometric mean diameter (μm) and geometric standard deviation, respectively, of multiple MOUDI samples (two sets for water-insoluble DTT, five sets for water-soluble DTT, per volume of air). Shaded color represents the mean frequency distribution. Each black curve represents the frequency distribution from each MOUDI measurement. The equation for the frequency distribution can be found in the Supporting Information.

