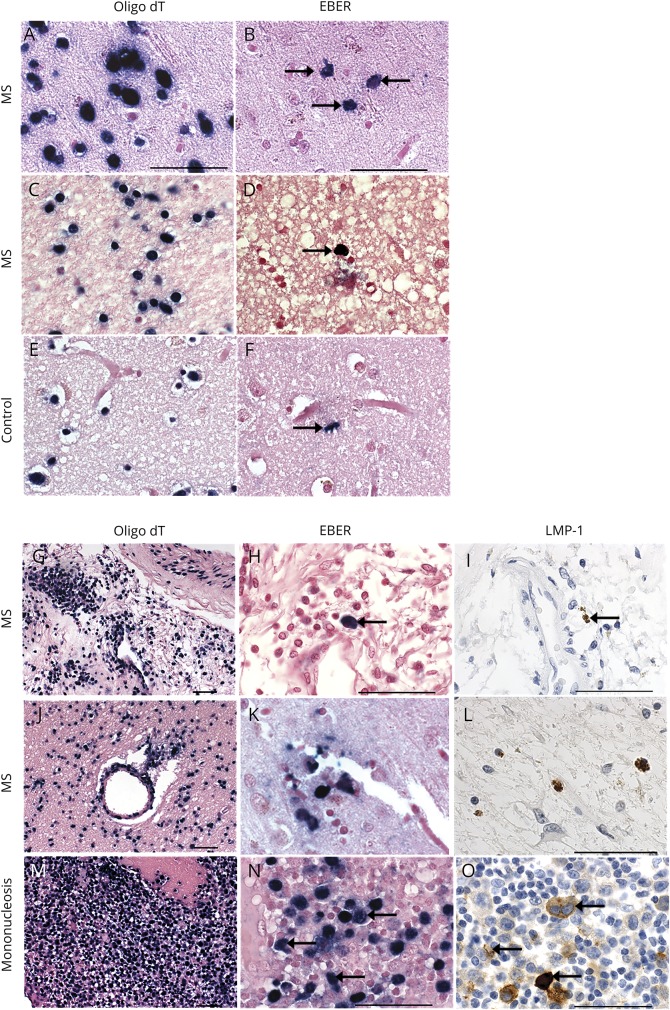
Figure 4. Detection of EBER+ cells in MS and control brains by in situ hybridization.
In situ hybridization for EBER detects EBER+ cells (blue-black nuclei, black arrows) in 4 representative MS brains (B, D, H, and K) and 1 representative control brain (F). In situ hybridization for EBER and immunohistochemistry for LMP-1 show EBER+ and LMP-1+ cells in the same region or nearby regions in 2 representative MS brains (G–L). Tonsil tissue from a patient with infectious mononucleosis (M–O) shows colocalization of EBER and LMP-1. RNA preservation in samples is corroborated by in situ hybridization for oligo dT in serial sections from the same MS and control samples (A, C, E, G, J, and M). Scale bar = 50 μm.

