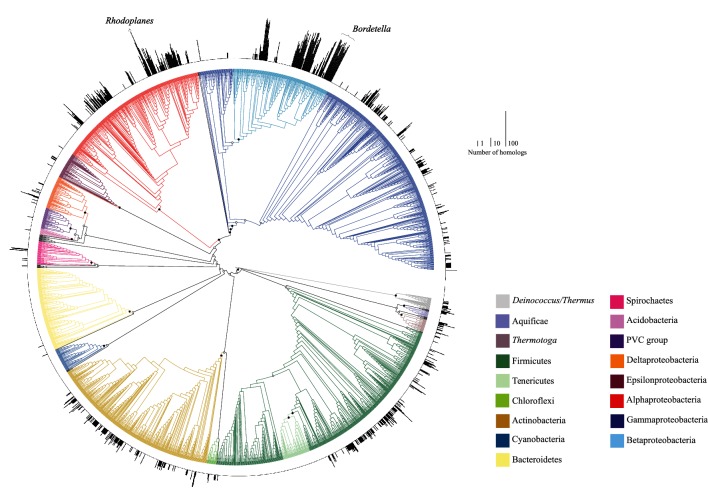
Fig. 1.
Distribution of TTT SBPs in the genomes of bacteria. The outer circle represents the number of TTT SBPs present in each genome, using a log2 scale. The tree was inferred using 16S rRNA sequences retrieved from the genome of each organism, and aligned using MAFFT v7 [37]. A maximum-likelihood tree was inferred using RAxML v8.2.11 [38] under the GTRCAT model, with 100 bootstrap pseudoreplicates. Bootstrap support values are indicated on nodes of major lineages when higher than 50 % (inclusive; filled circles) or lower than 50 % (open circle). Major branches are coloured as indicated in the key. Non-coloured branches are minor lineages of Bacteria.

