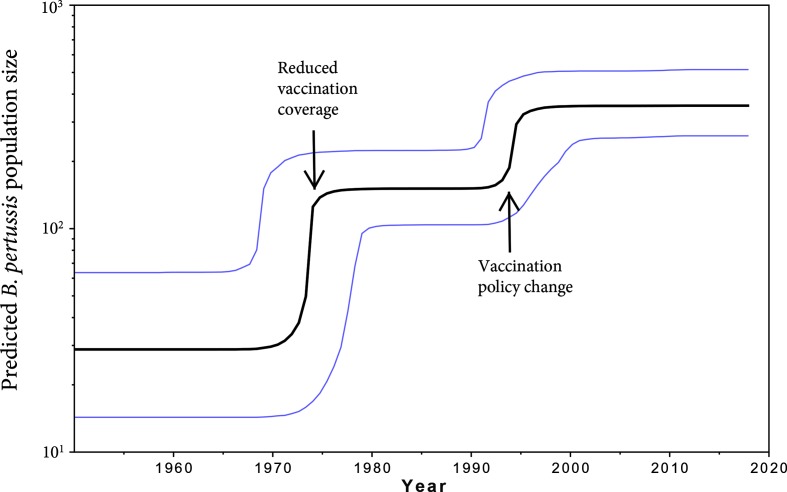
Fig. 4.
Bayesian Skyline Plot of B. pertussis in Japan, excluding Konan Kosei isolates. Fluctuations in the B. pertussis effective population size per year relative to the sample data were inferred from the fluctuations in the number of mutations in the B. pertussis genomes sequenced. The 95 % CIs are in blue. The predictions are based on the molecular clock data analysis as determined by beast (see Methods). Coinciding events that may affect population size are marked by arrows.

