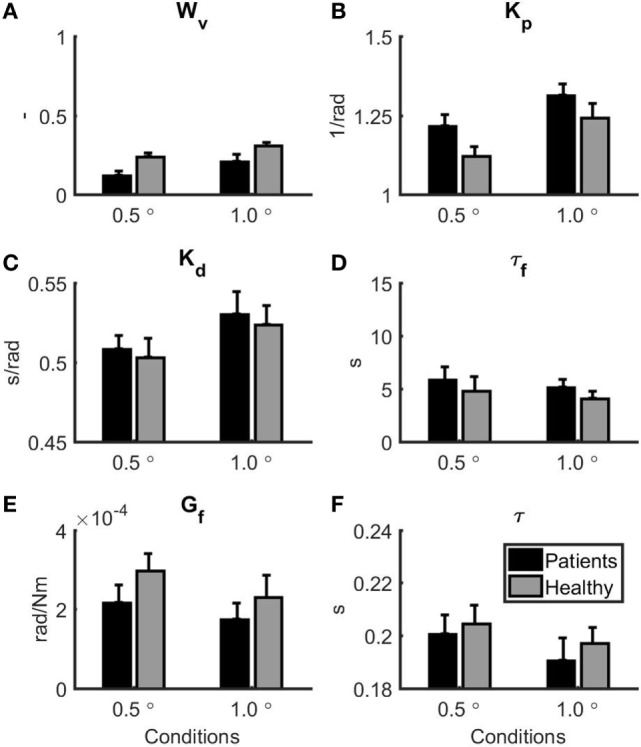
Figure 3.

Parameter estimates for the patients with vestibular dysfunction (black) and healthy subjects (gray). 0.5° represents the 0.5° peak-to-peak condition and 1.0° represents the 1.0° peak-to-peak condition. Error bars represent SE. (A) Vestibular weight, (B) reflexive stiffness, (C) reflexive damping, (D) force feedback time constant, (E) force feedback gain, and (F) time delay.
