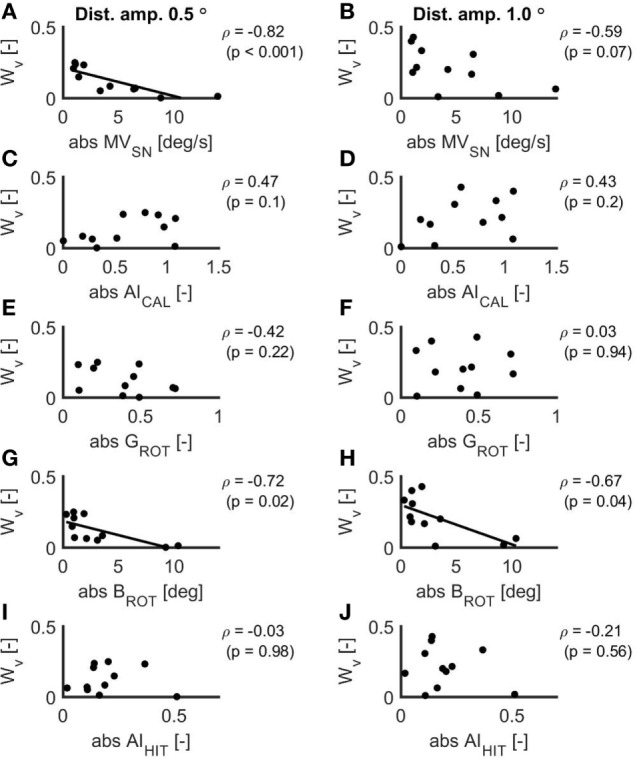
Figure 4.

Scatterplots of the relations between the absolute values of the mean eye velocity during spontaneous nystagmus examination (A,B), the asymmetry index as established with the caloric test (C,D), the ocular response gain during the rotational chair test (E,F), the ocular response bias during the rotational chair test (G,H) and the asymmetry index as established with the head impulse test (I,J) and the vestibular weight during a peak-to-peak disturbance amplitude of 0.5° (A,C,E,G,I) and 1.0° (B,D,F,H,J). In case of a significant relation, the linear fit is included in the scatterplot.
