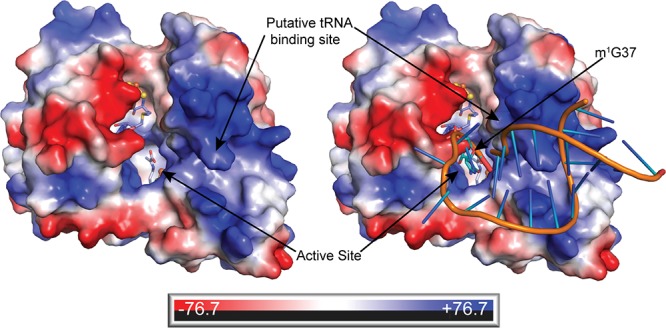
Figure 4.

Electrostatic surface of TYW1. The surface of TYW1 is colored on the basis of its electrostatic properties with positively charged areas in blue and negatively charged areas in red. A path of positive electrostatic surface leads from the active site to a putative binding site for tRNAPhe. SAM (C in slate) and KAC41 (C in light blue) are shown in sticks. A model of a 20-base-pair tRNA anticodon stem loop (PDB 1EHZ in orange) is shown against this surface. The site of tRNA base modification, m1G37 (C in teal), is shown as sticks in the active site.
