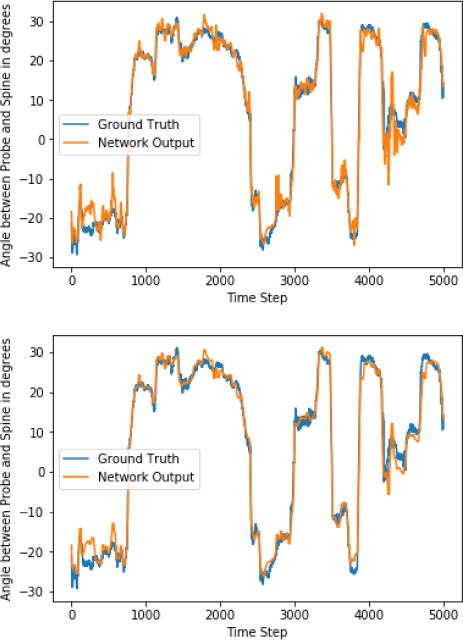
Fig. 2.

Graph of estimated and actual ultrasound probe angle as the probe is moved and rotated along a spine, for testing data. Top graph: raw network predictions. Bottom graph: median filter applied to the predictions. The neural network estimates this angle using only the image data. At transitions between vertebrae and at time step 4300, the angle measures temporarily degrade, but otherwise, the estimated and actual angles are typically within +/− 2°. The full system applies median filtering to these data to eliminate local irregularities.
