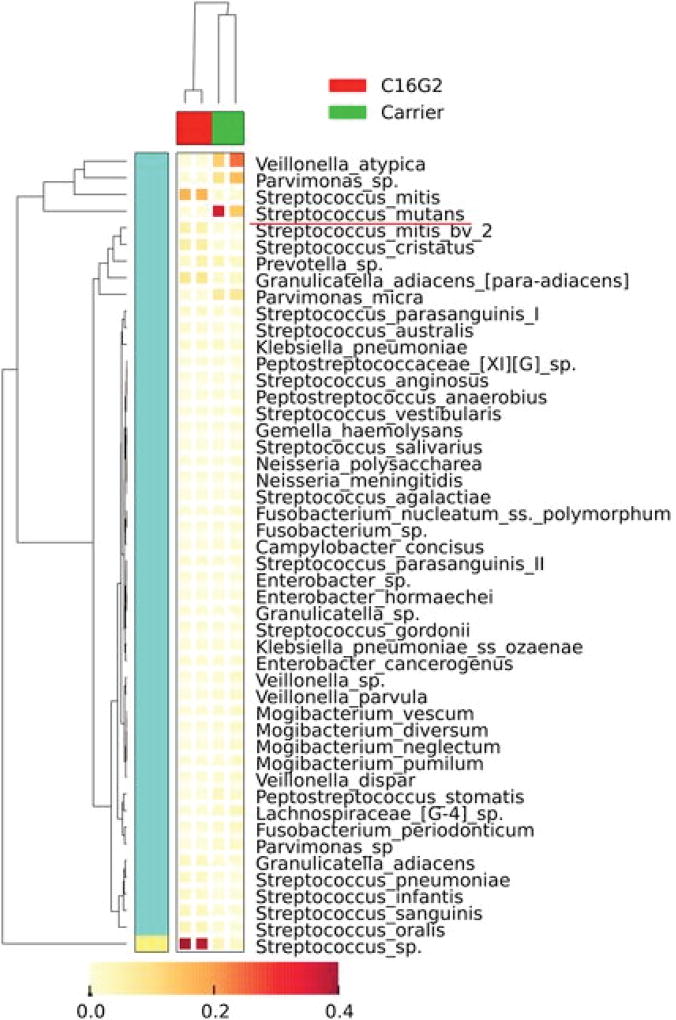
FIGURE 2.
Cluster analyses of oral taxa-weighted abundance profiles obtained from regrowth after treatment with Carrier (negative control) and C16G2. Relative proportions of the total taxa abundance are indicated in the heat map, which shows how the dominant taxa varied. The figure is modified from Guo and colleagues (51).

